Endurance training update 01: trail running baselines and outcomes
Applying product management and design practices to endurance training — first report.

As I make progress toward several personal endurance training goals this year, I’ve been applying some practices from product management and design to define my strategy and intentionally iterate my practices.
I’ve written about these iterative practices before, but they can be summarized as follows for this context:
- Discover opportunities for my endurance running journey — understand what I can about problems/challenges that I might want to pursue.
- Assess baselines and potential outcomes — form strategies and “bets”/hypotheses leading to possible solutions.
- Prioritize and strategize — decide a course of action and roadmap it.
- Act by designing training sessions, training, reflecting, learning, and iterating toward desired outcomes.
Outcomes
This year I intend to run at least two official ultra races. One is in May and the other in September. While both of these races are ultra trail races (not the 100 milers) one of the outcomes I’m aiming for is running beyond a marathon distance for the first time.
And if things go exceedingly well, we’ll see what bonus competitions I might sign up for before year’s end…
Metrics
It’s important to measure some indicators so that I can assess how my changes impact my progress as I train. This allows me to be agile in that I can continuously learn and adjust as I experiment.
The chart
To achieve the outcomes I’m targeting I’ve created a chart which I’l update each week as I analyze my progress, learn from what’s working and what’s not, and adjust my tactics to reach my desired outcomes.
What's not reported in the chart
The chart will be a dashboard I can use to share my progress with you, but it’s important to acknowledge that the chart does not include some key aspects of training. These are all things I have instrumented and will be looking at at least occasionally.
- Fuel — nutrition is something I’m fine tuning all the time and it has a huge impact on performance. I won’t be publicly sharing those details, but I may from time to time share things I’m learning in my training.
- Sleep — sleep and rest are vital for high performance. Again, I don’t intend to share the details of my sleep patterns publicly, but may share learnings from time to time.
- VO2 max
- O2
- Respiratory rate
- Vertical oscillation
- Stride length
- Heart rate
- Training zones
- Elevation gain
- many other metrics…
What is reported in the chart
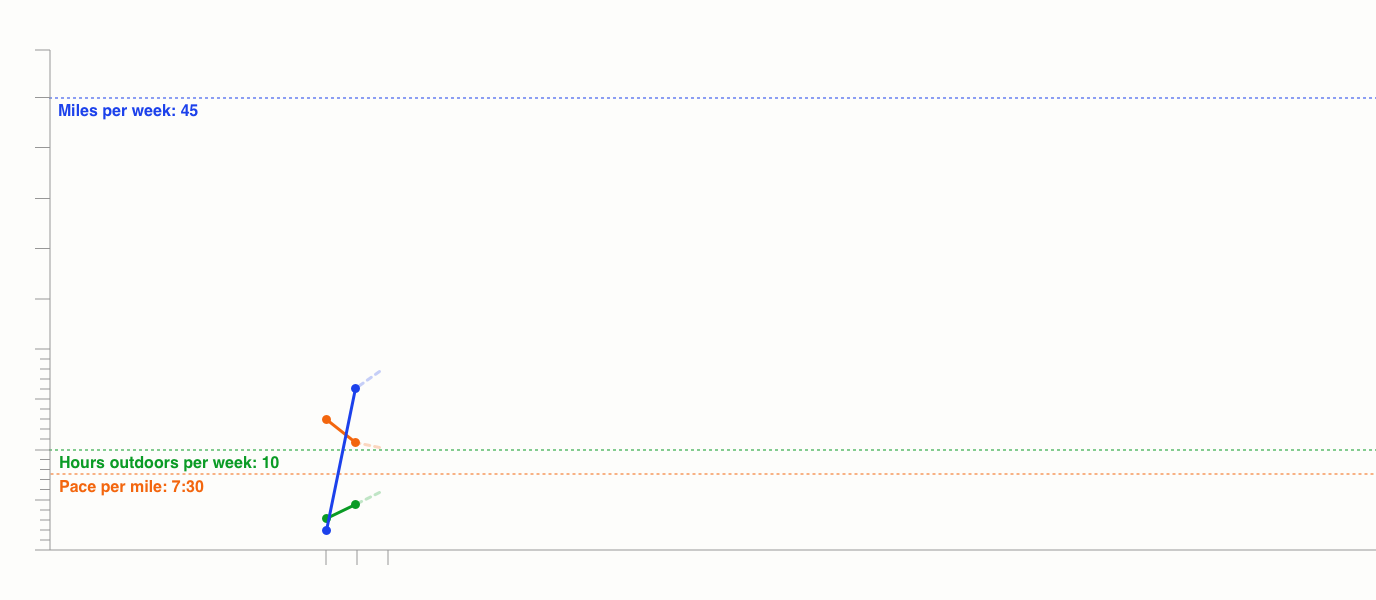
The chart will track my goals in three areas on a weekly basis. I expect to learn a lot about pursuing these goals as I train, but I also expect to learn a lot about how realistic these goals might be. As I learn more I may need to adjust.
- distance — the total distance run per week. My goal is 40 miles per week by the end of the year.
- time outdoors — the number of hours I’m outdoors each week. My goal is at least 10 hours per week.
- pacing — the inverse of my average pace per week. My goal is to average 7:30 minutes per mile.
What's next
I'll continue to publish updates to the chart along with insights as I progress. I expect this will evolve and the visuals for the chart will improve over time.
Questions and feedback
If you have questions, ideas, or feedback on these updates, please post a comment or reach out to me directly or on Strava or AllTrails.